#5Multiple Choice
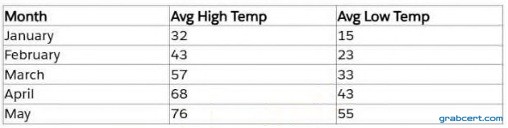
A Tableau consultant is tasked with creating a line graph that shows daily temperature fluctuations. The consultant is given the below set of data to use to create a dashboard.
How should the consultant manipulate the data to support the business need?