#10Multiple Choice
A Data Analyst has the following map that shows profits per state in the United States.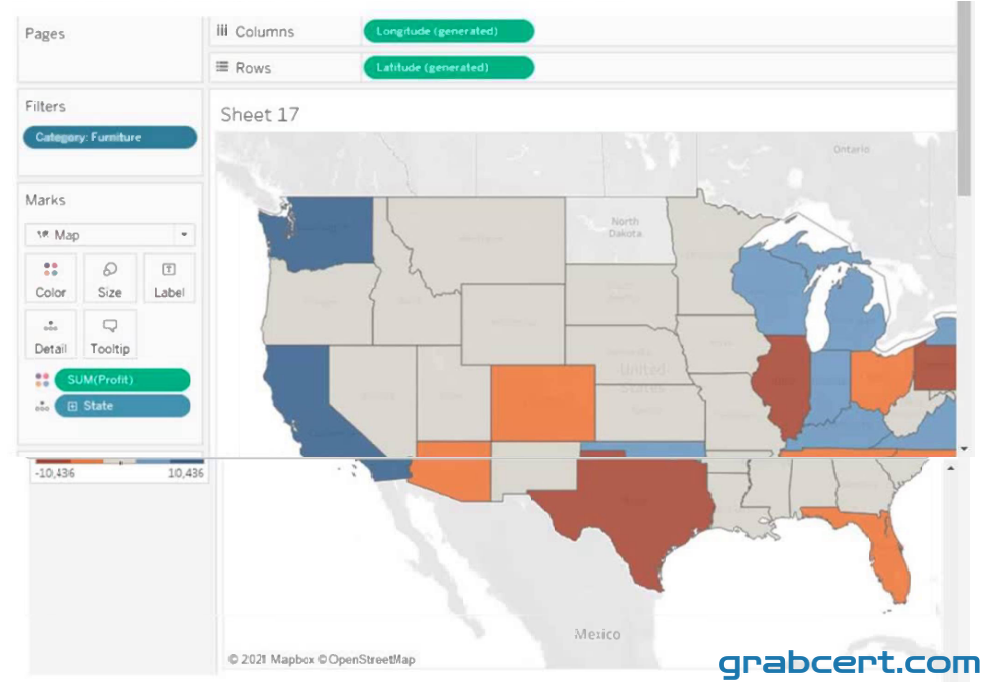
How are the colors configured for the map?
A Data Analyst has the following map that shows profits per state in the United States.
How are the colors configured for the map?