Back to Exams
TableauTDA-C01
Tableau Certified Data Analyst
This certification validates practical skills in business intelligence and reporting, including data preparation, analysis, governance, and communicating reliable insights. It is intended for professionals who build or operate data-driven solutions.
Rate this exam
Exam Details
Total Questions
214Last Updated
Aug. 2026Rating
4.8
Question Types
Multi choices
158Drag&Drop
13Simulation
22Hotspot
21 Get Full Access
Unlimited access to all questions
Detailed explanations for every question
Page progress: 2 / 435%
#6Drag & Drop
DRAG DROP -
Your company has two divisions located in the United States and Germany. Each division has a separate database.
The following is a sample of the sales data for the division in the United States.
The following is a sample of the sales data for the division in Germany.
You have population data in a file named Population.csv. The following is a sample of the data.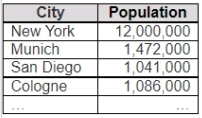
You plan to create a visualization that will show the sales per capita for each salesperson. Each salesperson must be identified by their full name.
You need to prepare the data to support the planned visualization. The data source must support being published.
Which four actions should you perform in order?
(Place the four correct options in order Use the arrows to move Options to Answer Area. Use Answer Area arrows to re-order the options.)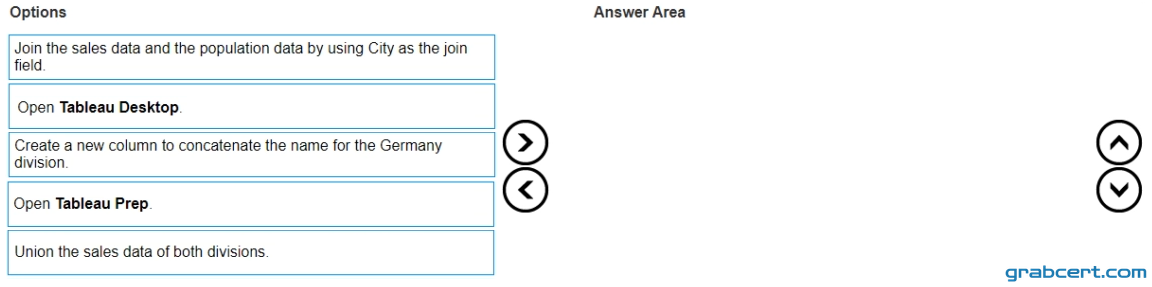
#7Drag & Drop
DRAG DROP -
You have the following dataset.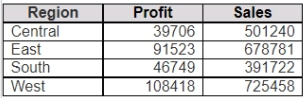
You need to create the following worksheet.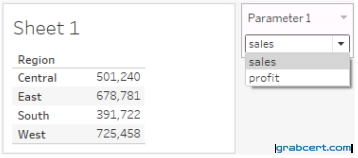
The table must show either profit or sales based on the selection from the Parameter 1 menu.
Which three actions should you perform in order?
(Place the three correct options in order. Use the arrows to move Options to Answer Area. Use Answer Area arrows to re-order the options.)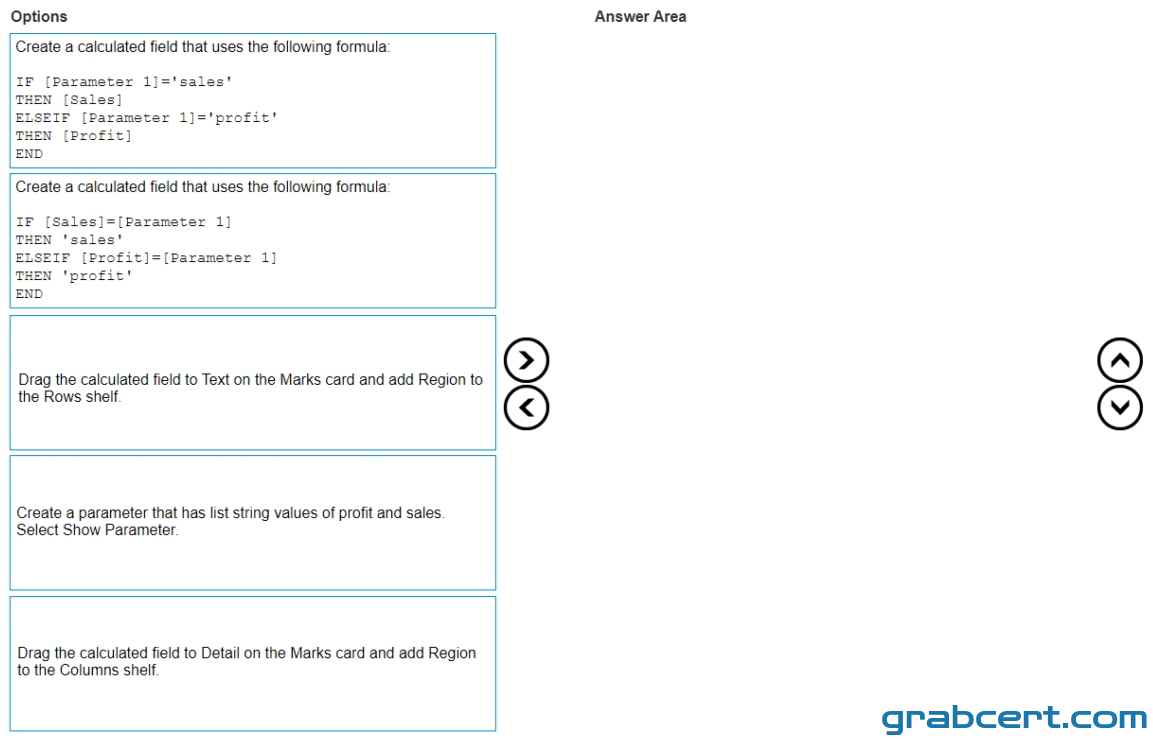
#8Multiple Choice
You have a line chart on a worksheet.
You want to add a comment to March 2020 as shown in the following visualization.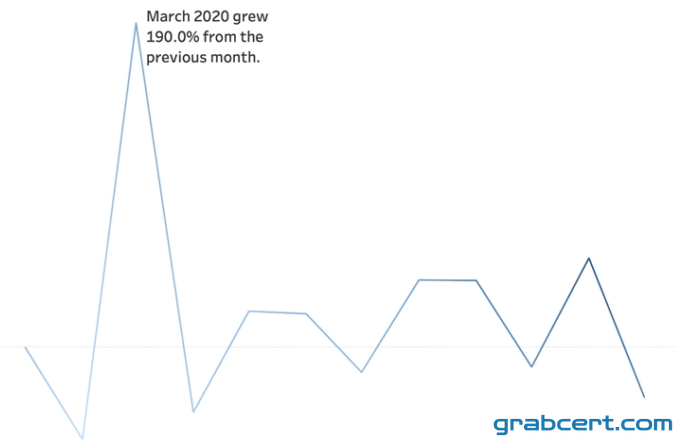
What should you do?
#9Multiple Choice
You have the following dataset.
You need to create the following visualization.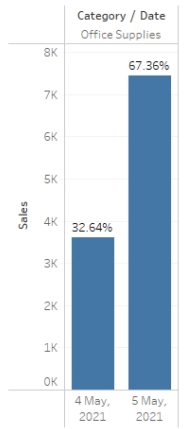
Which quick table calculation should you drag to Text on the Marks card?
#10Multiple Choice
A colleague provides you with access to a folder that contains the following files:
Sales.csv -
Book1.twb -
Sales.hyper -
Export.mdb -
Which file contains an extract?